“That’s not real art.” “When are you going to change your style?” “You have a ways to go…” “I’m not impressed with your understanding of art.”
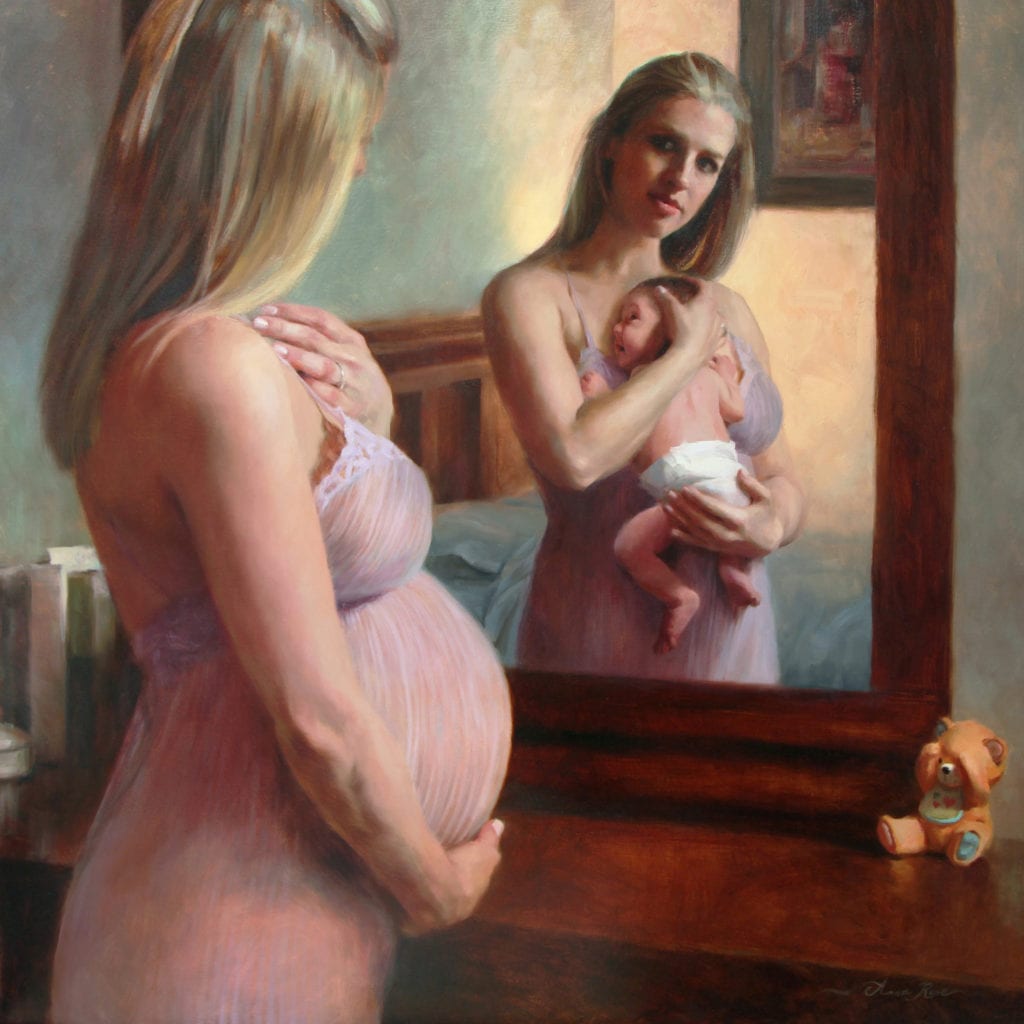
Have you ever been told these things before? I have. And like most artists, I am deeply sensitive to criticism. (Ok, I’m deeply sensitive in general, but that’s beside the point). Sometimes one negative comment, even in a sea of positive ones, can send me reeling and make me want to throw in the towel. Or, I allow my own negative thoughts to creep in and get the better of me. “The Wait and the Reward” – 30×30″ – oil on linenCriticism can be a tough thing to deal with, and with the start of a brand new year, as we artists set out to create our best work yet, I thought it would be helpful to address this topic. Just to clarify, when I talk about criticism, I’m NOT referring to critique. These are two very different things, and I believe that a good critique, from someone you respect and look up to, is extremely important for continued artistic development, even if it hurts to hear. I could write another post on this subject, and I think it’s worth writing… but that’s for another time. Today I want to focus on how to deal with criticism, i.e., negativity, either from others or from ourselves.
In this day and age, art is subjective. We know that not everyone is going to like what we do, and that’s fine. But negativity can put a real wrench in the creative process. How do you move on when someone lambasts you on your Facebook page, or tells you not to quit your day job, or speaks to you condescendingly? I once had someone (a much older person than myself) tell me, “You can’t really paint anything interesting or worthwhile until you reach an age where you have lots of real life experience.” I wasn’t sure how to respond to that. Gee… I guess I should wait until I’m 65 to start painting.
Well, here are a few things I have learned over the years (and some more recently!) on dispelling negativity.
Have a high level of self worth. If you believe in your heart that you’ll never be good enough, then negative feedback will get you down. But if you believe that you, as a person and artist, have value, with a life story worth telling, then you won’t be crushed when you encounter the occasional bad apple.
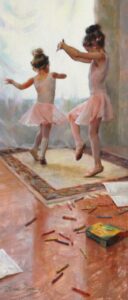
“Fledglings” – 20×24″ – oil on linenOwn your style, and use it to tell your story unashamedly. Whether you were self-taught, schooled in a traditional atelier, or a frequent workshop attendee… all of those learning experiences have shaped who you are as an artist. Don’t downplay your education, just because it’s not the same as someone else’s. If you don’t like your style or aren’t sure what you want to say, spend some time improving your technique, and seek out council or insight from someone you trust. Sometimes an objective viewpoint can help you see yourself more clearly. Just remember that at the end of the day, no one can create your art like you can. No one else puts down a brush stroke in the exact same way you do, and if you think about it, that’s really cool.
Try seeing it from the other side. Negative comments often stem from insecurity or envy. It just might be that the person trying to hurt you is actually going through hard times themselves.
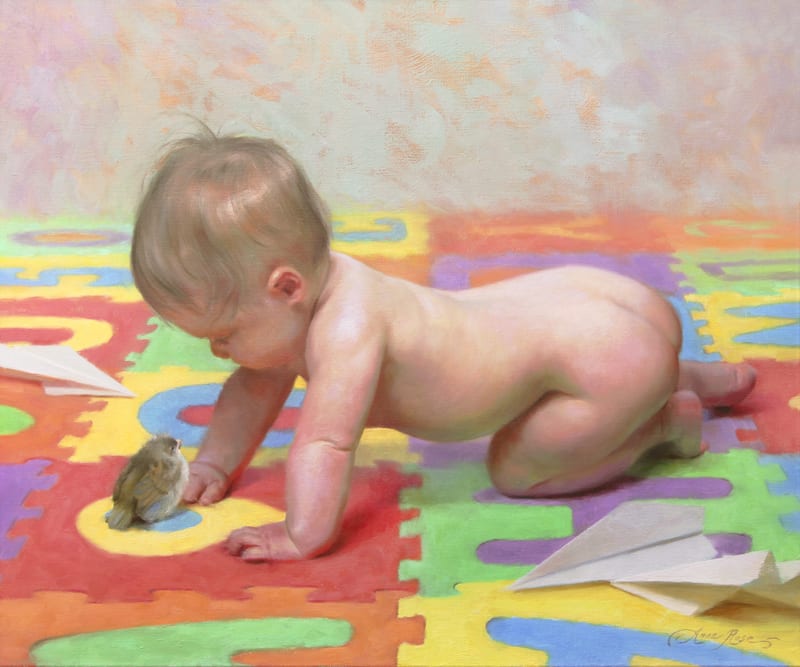
“Innocence” – 28″ x 12″ – oil on linenLearn to cast out negative thoughts before they begin. Phrases like, “you’re not good enough,” or “your painting sucks today…” are the devil on your shoulder. They are not your thoughts and they are not who you are. Take every thought captive. Don’t let negativity, or the pressure to make money or win awards, or someone else’s worldview being imposed on you (telling you what kind of art you should be making and for what purpose) affect your productivity or your belief in your art. One technique used by marketing gurus is to speak aloud the word “cancel!” every time a negative thought enters their mind. There is power in the spoken word.
Turn a negative into a positive. Maybe someone criticized you and it stung. But before you write off their comment entirely, ask yourself if there was some truth to that, and if you could use it to improve your work. You may find you come out stronger and better for it!
So, it’s a new year, with limitless creative possibilities. My goal for 2015 is stay positive. EVERY DAY. I hope you’ll do the same, and I wish you a very happy, artful New Year!
Beyond packing plenty to drink, a midday snack and lots of sunscreen, painting en plein air can go from a beautiful day with Mother Nature to a fight for your life if certain precautions aren’t taken before throwing on the back pack and heading down a trail. I have painted plein air for almost twenty years and in that time I have encountered my share of treacherous weather changes, more snakes than I can count, rutting elk, a very upset larger than life brahma bull, wild pigs, bobcats, two black bears and bandits intent on taking my wallet. That does not include the number of times my life hung in the balance as I negotiated a narrow canyon ridge or large trucks narrowly taking off my backside as I painted on side of the road.
Over the years I developed a healthy respect for how quickly things can change when painting outdoors and have developed my own personal set of safety precautions along the way.
Don’t Post on Social Media.
The safest thing you can do for yourself and your family is to NOT post pictures of yourself while out of town. I am as guilty as anybody of posting on social media while traveling. Who doesn’t want to show all your friends that you are painting along the California coast or traveling to France to teach a two week workshop? I do you it. You do it. We all do it. STOP!
There’s no better way to announce to the world that your home is vacant and ripe for the pickings than to post pictures of yourself out of town or boarding a plane to Europe. Instead post date your blog so it is published while you are away. Then share your blog on Facebook and Twitter. This keeps you active on social media and it appears you are at home. If you must post on Facebook or Tweet something, post a picture of yourself in the studio or what you have on the easel. With a little planning you can post something several times while traveling to make it appear you are home working away at your easel.
Believe it or not the world can go a week without hearing from you. Please wait until you return home to post pictures of your trip, workshop or paintings.
Paint with a group (L to R) Rusty Jones, Bob Rohm, Bruce Peil and David BatesI cannot stress this enough. As much as I enjoy painting alone next to a running stream deep in the woods, it is far better if someone knows where I am. Painting with a group provides safety in numbers and companionship.
Let someone know your plans Whether you are painting a few miles from home or hiking into the back woods ALWAYS let someone know your plan, including what time you plan to return. If your painting excursion takes you away from your group or public view, leave a written plan with someone you know, a park ranger, hotel clerk or even a gas station attendant. Include a trail map with your plan highlighted in red ink, vehicle description, vehicle license plate number and a recent photo. Most importantly, let them know when you plan to return.
Make yourself visible. Most of us tend to dress fairly drab because we don’t want a brightly colored shirt reflecting onto our canvas while we paint. The problem is we blend in and therefore are hard to spot, especially if we are standing on side of the road or, in a worst case scenario, become incapacitated deep in the woods or on side of a mountain. Taking a hint from my running buddies I have started wearing luminous shirts over my painting shirt while hiking into and out of a location.
I buy an XXL so it fits comfortably over my other shirt. This one cost me $5 at Walmart and can be spotted a mile away. Once I get to where I’m going I take it off. On my arm is a Spot GPS device. More about that later. In addition, when I am painting on side of the road I put out safety cones. I put one at least 500 feet away, then one half way and one right next to where I am painting. Make sure you get the ones that have the reflective stripe on them. The ones pictured cost about $15 at Home Depot, Lowes or Amazon. We plein air painting types are notorious for trying to capture that last ray of setting sun and that is when we are most likely to get hit by a passing motorist. Headlights hitting the reflective stripe could be a life saver.
I also hang the luminous shirt on the roadside corner of my car because that shirt will be seen before my car.
Be trackable. Don’t rely on your smart phone. Before heading off on an unmarked trail or down that rarely traveled dirt road give some thought to the possibility of something going wrong and how you will handle it. As a society we have become too dependent on our smart phones and their GPS abilities. Anyone who has traveled west knows how difficult it is to find a signal in the mountains or northern Arizona for that matter. Good luck on much of Highway 1 along the California coast as well. How many of our smart phones require a four digit code to open? Heaven forbid, but if you are hurt, unconscious and someone else finds you, chances are they will try to use your phone to contact someone you know. If it is blocked because your phone needs a code, it can greatly hinder emergency personnel from contacting someone on your behalf. I had two personal experiences with this exact scenario just last year.
On the back of your phone tape the phone number of the person you need contacted if for some reason you are unable to make the call yourself and someone else needs do it on your behalf.
Now back to the Spot GPS device. The SPOT motion activated GPS is one of several type tracking devices on the market. I wear it clipped to my back pack. The Spot provides location-based messaging and emergency notifications that track you worldwide using satellite networking. There are no drop zones and once the SPOT is turned on you are immediately being tracked. Notice several buttons at the bottom. One is an “OK” button that notifies friends or family that everything is going as planned. Another button is for tracking so your contacts can track you on a map using their computer or smart device. Another is the S.O.S. button for emergency rescue. If you hit the S.O.S. button emergency crews are immediately notified of your location and dispatched to find you. To save battery life it shuts down when you stop moving for more than five minutes then starts up again when you begin moving.
What to do if you get lost?
Let’s assume first that you have left your plan with family, a friend, a park ranger or someone else you can depend on. When going hiking on an unfamiliar trail or down a road you are not real sure about, I make the following suggestions: Pay attention to your surroundings. Pick out landmarks going into a location so you will recognize them on the way out. Recognize when you are lost, turn around and go back. Monitor how you are feeling. Especially at high altitudes or in low humidity locations. Be aware of your physicality at all times. Hence the extra water and snacks. If you cannot get out on your own stay near an open area so emergency rescue can spot you from the air. Make a signal by placing your luminous shirt in open view. Start a fire for warmth at night and smoke during the day. And finally I thought I would share a few safety essentials I carry in my back pack and suggest you do the same. All of the items shown add about a pound to my pack.
Starting with the rather large knife on the left and going clockwise the following items are pictured: pocket knife, first aid kit, flashlight, utility tool, headlamp, emergency blanket and a 5-in-1 survival tool.
My latest addition is the lighted Powercap by Panther Vision. All my hunting buddies swear by them. Three different levels of light intensity provide plenty of hands free light. I want to try doing a nocturnal painting with it.
And finally the 5-in-1 survival tool. This tool is a must and should be every plein air painter’s back pack.
I hope you found this blog helpful and maybe gave you some food for thought on how to make your plein air experiences safe. If you have any safety tips that you use, not mentioned in the blog, please share. Happy painting everyone. “Runoff” 18″ x 24″ Oil/Linen
When I began to think about the topic of working from photos or working from life, I thought back to when I first began painting. At that time I was focused on recording all the details I could. I had very little thought of how my paintings could be more than just a faithful recording in paint of what the camera had captured. Photography became a crutch for me. In the end I slowly lost the skills of drawing and the sensitivity of color, value and edge information needed to help communicate my own unique vision of the world around me. Sure my paintings looked like the photo I was working from, and on occasion, I was able to capture a little bit of the life of the subject I was painting, but for the most part my paintings were lifeless. I was lacking all of the things that make for an interesting painting and for me, probably the biggest, poetry. I know poetry in a painting is pretty vague and very individual, but I think we all feel it when we see it in a great piece of art. Painting from life has always been about the experience and the knowledge gained from studying life. I cannot think of any better way to grow as an artist than to work from life. A question to ask yourself is what is more important to you, the finished painting or the experience gained while creating the painting?
Certainly, photography used as reference in a painting has its place, as long as we can avoid the pitfalls of working from them. Photos rarely capture accurate color and value. (I should say my photos rarely capture accurate color and value.) Some of you are probably better photographers than I and don’t have this problem. Working from a photo really is just a memory exercise. You’re asking yourself what color was that when I took that photo. This is when all that time you spent working from life comes into play. The more you work from life the stronger your paintings will be when working from a photo. Every time you work from life you’re creating a visual library in your brain. When you’re back in the studio, you can access this visual library when working from a photo that is lacking the information you need. One of the benefits of working from a photo is the opportunity to explore subject matter that working from life doesn’t always allow. We’ve all been on vacation somewhere when we see something that we would love to paint, but it’s happening so quickly that trying to paint it would be impossible without taking a photo. This is when taking a photo and making some visual notes in a notebook can be of great help when you’re back in the studio working from that photo. Taking the time to study the scene and making those visual notes either in a notebook or in your mind is very helpful. We’ve all be caught up in the moment where we see a great subject and we just start snapping picture after picture, without any thought of making some mental notes as to what we’re seeing. When we get back to the studio, we’re often disappointed that our photos didn’t capture what we saw.
Photoshop can be a great tool for artists who want to play around with different color combinations and compositions. Changes in colors can be very easy to do in photo editing software. This can be very helpful if you want to change the color of a piece of clothing your model is wearing to see how different color combinations work in your painting. You may also want to try collaging different photos together to try different compositions as well. The possibilities for editing your photos are endless for someone who understands Photoshop. In the end, any photo editing software is just another tool for the artists. An artist needs to determine if it’s something you want to experiment with. I think Dean Cornwell sums it up best when he said, “Do what the camera can’t do- the camera can’t add the spiritual; it can’t go beyond the mentality of its models. Test your work ask yourself can the camera do what I have done? If you can make a real picture you won’t have to worry about the camera.”
I hope we all will continue to work from life as much as possible. Understanding that photography is just another tool we can use for exploring new creative ideas, but should never become a crutch for developing the skills and experiences that can only be found when working from life.
A question that invariably is asked by students or observers during a workshop or demo is “How do I develop a style?” A comment I often hear from fellow artists at shows, galleries and museums is “I would recognize his/her style anywhere.” As artists, we want our work to stand out for its individuality, to be recognized as part of our body of work and for what we have to say as an artist even though our style may evolve throughout our career.
Brush mileage is the answer we hear for how to become proficient as a painter. I believe this applies to developing a style as well. Style develops while learning to master the elements that are essential in a great painting. When an artist takes on the prolonged study of painting, the essentials become a natural part of the artist. Hopefully, we will continue to learn and grow as an artist, to experiment and improve. As a result our style becomes a work in progress.
The elements listed below have been discussed and dissected in countless books and articles. They are intertwined in a painting and cannot be completely separated other than as a basis for study and learning. Daniel Gerhartz I have chosen paintings by two artists working today to illustrate some of my points. Both artists presented here are representational painters, painting predominantly alla prima and both are bravura. Each has a style decidedly recognizable as their own. Their use of edges, color and value is impeccable. Their works have a sense of place, a sense of light and, for me, a sense of love.
Color Palette – As artists, we choose to limit the number of colors we lay on our palette. We choose which warms, which cools, which darks and lights, transparent and opaque, so on and so forth. We will during the course of our career even zero in on brand choice. So, our palette and choice of colors becomes part of our recognizable style.
Walt GonskeValues and value range – Great artists are superbly accurate on “getting the value right”. They usually can be recognized by the key or value range that most of their paintings fall. In the paintings presented here, Mr. Gerhartz used an overall dark tone which unifies the painting; Mr. Gonske stays high key throughout. Both present a magical sense of light through the use of values as well as value range. Composition and Focal Point – An artist moves you around and through a painting with the use of darks and lights, pure rich colors and grays as well as where they place the focal point. Edges, texture and brush strokes are crucial in aiding this movement around the painting and to the center of interest. Edges – The use of edges, soft, hard and intermediate serve to strengthen the composition. Sometimes I think that the pursuit of edges may be the most difficult to master. Texture – This applies not only to thick/and or thin application of paint, but it also applies to the surface we choose to work on for each painting: from gessoed boards to stretched or mounted linens and canvas, fine weave to coarse weave, etc. I have seen beautiful works painted on copper and on aluminum salvaged from soft drink cans. The surface we choose becomes very much a part of our style. Brush strokes and paint application – Choice of brush, i.e. bristle, sable, nylon, filbert, flat, bright, etc. or palette knife, whether applied thick, thin, broken, and the length of stroke becomes inherent to the artist. This inherent quality helps to mark his style, it is his signature so to speak. Subject matter – I have often heard it said that there is no new subject matter, just new ways to present it. That uniqueness of presentation is style. It is what differentiates us as artists and as human beings.
In his book, Alla Prima, Richard Schmid tells us: “Do not ask yourself, “What do I see?” Rather ask, “What do I see?” In doing so, we are on our way to developing our own style.
In Robert Henri’s classic book “The Art Spirit,” he speaks of “more than ordinary moments of existence.” A spontaneous trip to Madrid with my artist friend Jim Aplin led to such a moment. Actually it was a series of moments over a period of three days. The setting was the Sorolla Museum. This is no ordinary museum. It is the artist’s home and studio. It almost feels as if he might step back in the room at any moment.
There is nothing so inspiring as standing in front of a great work of art and studying every brushstroke. Joaquin Sorolla filled his canvases with skillful drawing, rich color and juicy brushwork. A feast for the eyes.
His materials and supplies offer an intimate and fascinating view of the man and his methods.
At the age of 57, while out in the garden working on this portrait, Sorolla suffered a stroke. Although he lived another three years he was never able to paint again. But what an extraordinary body of work he left for the world to enjoy, and what an inspiration he continues to be.
“My only ambition was to create an honest picture that would interpret nature as she really is, as she ought to be seen.” -Joaquin Sorolla (1863-1923)